
Executive summary
Middle Eastern crude exports have partly recovered from severe disruption starting from Q1 2026. However, shipping insecurity, increased freight costs and damaged refining capacity continue to affect the price and reliability of energy delivered to businesses in Asia. The US Energy Information Administration (EIA) forecasts Brent crude at $105/bbl in Q4 2026, $14 above its September forecast. [1]. Three findings shape the outlook:
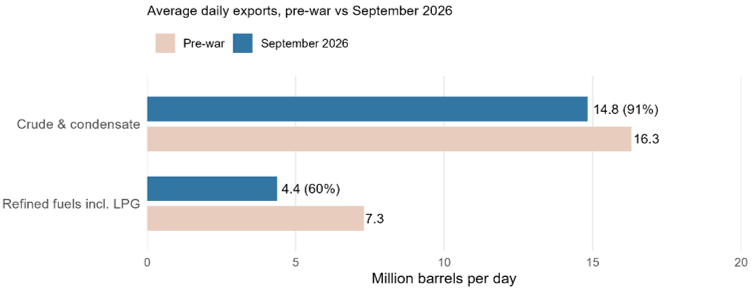
- Crude oil supply recovered faster than the supply of refined products. In September, crude and condensate exports from seven Gulf producers, excluding Iran, reached 91% of their pre-war average, while refined fuel exports (including LPG) recovered to only 60% which explains why a recovery in crude availability has not stabilised fuel markets. [4]
- Asian economies face different exposure to higher economy costs and varying capacities to manage them. Under a hypothetical 20% increase in imported fuel prices, the potential increases in import costs varied across countries but they are not projected losses in economic growth. The actual impact will depend on each country’s specific conditions like India’s refining capacity, Indonesia’s limited fiscal flexibility and storage, Japan’s oil reserves and Singapore’s diverse energy source.
- Duration is more important than the initial price shock. Continuous energy supply disruption can erode corporate margins, lock-up capital in inventories, and strain public budgets, so potentially weakening investment despite stabilised crude price.
Corporate implication:companies should evaluate the actual costs and supply reliability of energy deliveries, rather than relying on oil price, while protecting liquidity and prioritising investment that remain commercially viable under realistic disruption scenarios
Recovering crude oil exports has yet to restore energy costs
Around 20 mb/d of oil and petroleum products were transported through the Strait of Hormuz in 2025, and 80% of them destined for Asia. The International Energy Agency (IEA) estimates that available alternative pipeline capacity is limited to approximately 3.5-5.5 mb/d. [3]. The disruption was important because in Q4 2025, EIA’s estimates show oil flow through Hormuz falls from 21.6 mb/d to 4.9 mb/d in Q2 2026 [2].
Since then, producers have partially restored exports by resuming shipments through Hormuz, using alternative ports and more complex shipping arrangements. However, the recovery has been uneven, as seen in Figure 1, that September crude oil and condensate exports from seven Gulf producers recovered to 91% of their pre-war average, while refined-fuel exports only recovered to 60% [4].
Figure 1. Gulf energy export recovery in September 2026 compares to pre-war volumes.
This difference is important because businesses and consumers purchase and use refined fuels and other energy products, not crude oil. Diesel, jet fuel, LNG and petrochemical feedstocks have different supply chains, processing requirements, and pricing structures which cause an increased crude supply to not necessarily reduce the delivered-energy costs.
Freight is the best example. As in early October 2026, the daily charter cost of a large crude carrier (with 2-million-barrel volume) from the Gulf to China reached approximately $1.2 million/day, while it was around $80,000/day in Q3 2025. It means one additional day for a fully loaded two-million-barrels cargo would be priced approximately $0.60 per barrel only in charter. Therefore, Saudi Arabia reduced its oil November 2026 selling price to Asia, below the Oman/Dubai benchmark, as an attempt to compensate buyers’ higher transport costs [5]. Discounts on crude pricing will not fully offset risks if freight rates, insurance premiums, delays, or product shortages remain increased. Therefore, end-users’ energy cost continue to be high despite discount and improving availability of crude oil.
Persistently high energy costs create three economic pressures
For net energy-importing countries, higher import price can reduce the capital available for domestic consumption and investment. The severity of the impact depends on how effectively a country can mitigate these costs through higher energy-exports earnings, substitution or reduce import demand. The adjustment transmits into businesses through three connected channels:
- Operating costs and demand pressures: rising fuel, electricity and transport costs reduce profitability unless the cost is passed to customers, but then it will trigger demand contraction as households and downstream businesses may reduce spending, causing energy-intensive producers to face both shrinking margins and lower demand.
- Foreign exchange (FX) and financing risks: surging US dollar-priced fuel imports will drain foreign currency reserves, which accelerate the local currency depreciation, and increase operating costs for businesses with unhedged FX exposures. While higher interest rates and risk premiums will amplify this financial strain, depreciation and financing costs will remain depending on wider macroeconomic conditions [6].
- Fiscal stability: fuel subsidies and regulated pricing can temporarily delay inflation for households and business by transferring the financial shock onto state budgets and state-owned energy enterprises. Prolonged support may deplete fiscal reserves, reducing government spending capacity for other projects and could cause aggressive price correction in the future [8].
These risks can reinforce one another and create a negative feedback loop. A manufacturer that absorbs higher-energy cost would need higher working capital when consumer demand weakens. If borrowing become more expensive, projects that previously expected to deliver attractive returns may no longer meet the internal rate-of-return thresholds, causing the investment to stall.
However, an energy shock does not always cause recession. For context, the Asian Development Bank’s (ADB) September outlook projects 5.0% growth for developing Asia and the Pacific in 2026, driven by domestic demand, capital investment and technology exports [7]. The main concern is that persistent energy challenges could weaken this baseline, mirroring IMF severe-scenario modelling that indicated an approximately 2% cumulative output loss by 2027 relative to its reference ratio. Although, this is a conditional model, not an observed economic decline or an official forecast [6].
Import exposure differs by country, but domestic buffers shape the economic impact
To baseline regional exposure, this analysis applies a uniform 20% increase in imported fuel unit values for one full year, holding 2025 import volumes constant to establish a standarised sensitivity benchmark. The additional annual import bill, expressed as a share of GDP is calculated as follows:

Table 1. Estimated additional annual gross fuel-import bill under a hypothetical 20% price increase
| Economy | 2025 fuel imports/GDP | Fuel share of merchandise imports | Additional annual bill (US$bn) | Additional bill/GDP |
| India | 5.33% | 28% | 42.2 | 1.07% |
| Japan | 3.41% | 20% | 30.2 | 0.68% |
| Indonesia | 2.52% | 15% | 7.3% | 0.50% |
Note: Fuel shares are rounded, the trade indicators use different statistical sources. The calculation assumes fixed physical import quantities, full-price transmission to import unit values and a static 2025 GDP denominator. This measures a gross import-cross sensitivity, not a net national income loss, actual 2026 import bill or GDP growth forecast.
India faces high fuel import costs with opportunities to off-set with refined-fuel exports. its refineries can process approximately 5.6. billion barrels of crude/day, while exports of diesel, petrol and jet fuel reached around 47 million tonnes in 2025 [13]. With Middle Eastern crude deliveries recovering in September and export duties on diesel and aviation fuel reduced from October, Indian refiners have big opportunities to supply Asian markets [13, 16]. However, higher crude oil and shipping costs could reduce profitability, and the domestic demand may limit the export volume.
Indonesia faces growing pressure on both its fuel reserves and limited fiscal buffers. In march, Indonesia reported fuel reserves sufficient to cover 23 days, with 25 days of maximum storage capacity [16]. Financially, energy subsidies and compensation payments had exhaust 84.3% of the annual budget and surged 54,1% y-o-y by September [15]. With the projected fiscal deficit reaching 2.85% of GDP, the government introduced spending restrictions in October to keep the deficit below the statutory 3% ceilings [12]. If the energy costs remain high, the government must restraint or reduce spending, limit fuel subsidies or adjust prices. For businesses, regulated fuel prices may provide short-term stability, but limited public spending and storage capacity could increase uncertainties.
Japan’s substantial oil reserves help protect them against disruption, but securing replacement is getting costly. Japan relied on the Middle East for 94% of its crude imports in 2025 [18]. EIA estimates show its reserves falling from 263 million barrels in Q4 2025 to 187 million barrels in Q2 2026 [2]. It has successfully sourced alternative shipments, but in August, officials reported that one alternative route took approximately 55 days to reach Japan, compared with previous 21-23 days which increase transport and inventory costs [17]. The main concerns for manufacturers now are whether Japan can sustain reliable energy supplies without prolonged increase in procurement and operating costs.
Singapore has maintained relatively stable energy supply, with different cost pressures for industries. Singapore processes and re-exports massive amount of fuel, meaning gross fuel import volumes do not reflect its domestic economic exposure. On 6 October, the government reported that crude oil and LNG inventories remain stable due to diversified supply sources [19]. However, it remains exposed on rising power costs as imported natural gas generates around 95% of its electricity [20]. Higher refined-fuel selling prices could improve refiners’ profit margin, while rising gas price may increase costs for manufacturers and service businesses. Therefore, Singapore main challenge is managing these uneven cost pressures across sectors while ensuring continuous energy supply.
Three scenarios for the next two quarters
For businesses, the main uncertainty through Q1 2027 is whether increasing crude supply will normalise delivery and restore product prices. The following scenarios represent conditional planning frameworks, not a probability forecasts.
Table 2. Energy disruption scenarios and management responses
| Stabilisation | Persistent friction | Re-escalation | |
| Market condition | Cargo deliveries are back to normal. Freight and refined-product premiums price decline. | Crude supply improves, but delivery costs, delivery delays, and refined product premiums remain elevated. | Attacks and infrastructure damages interrupt deliveries. |
| Commercial impact | Pressure on operating cost and working-capital begins to ease. | Profit margins remain under pressure while shipping delays increase costs, which reduce cash and weaken project profitability. | Higher emergency procurement costs and production disruption increase cash flow pressures and the risk of liquidity shortages. |
| Indicators to monitor | Reliable cargo arrivals, falling freight costs and product premiums. | Product price premiums and delivery delays persist despite crude recovery | Cargo cancellation and fuel shortage drive up the cost to secure replacement supplies |
| Management response | Gradually scale-back costly backup supply arrangements. | Maintain cost-effective measures to secure supply and conduct stress-test on cash flow and investment returns. | Protect critical operations, secure alternative suppliers, and review planned investments exposed to rising costs and supply disruptions. |
The persistent-friction scenario is particularly important because companies may underestimate risk when Brent prices begin falling. If diesel or LNG delivery costs remain high, companies could face continued pressure on profit margins and weaker investment returns even when crude price stabilise. Therefore, management should watch actual delivery delays and prices for energy products, alongside with other macroeconomic indicators.
Corporate priorities: protect operations without freezing investment
Secure critical energy supplies when the potential cost of disruption exceeds the cost of protection. Procurement teams should assess their dependence on Gulf-origin fuels, refined products and petrochemical inputs, including indirect exposures. Holding additional inventory, having alternative contracts, and diversifying suppliers are justified when the potential losses from production disruption exceed the costs of having those protections in place. Financial hedging can help protect against price increases, but cannot guarantee delivery.
Stress-test liquidity against combined shocks. Finance executives should asses cash flow against a combination of higher delivered-energy costs, currency depreciation and rising borrowing costs. Particular attention should go to cash needed to finance inventories, supplier payment terms, ability to pass costs to customers, and meet debt repayments. The objective is to determine how long the business can absorb pressures before cash flow weakens or struggle to meet financial commitments.
Prioritise investments that improve business resilience while reassessing vulnerable projects. Investment decisions should consider both the actual cost and reliability of energy suppliers, and should not rely on prices under normal market conditions. Projects that offer more flexible sourcing, lower energy consumption or stronger profit margins may justify higher upfront costs. Meanwhile, projects that heavily dependent on imported fuels, government subsidies, or the limited pricing power should be reassessed, with investments potentially approved in stages. Broader investment cuts on projects that could reduce exposure to future shocks could leave business more vulnerable.
Companies should adjust these decisions as market conditions evolve. Lower crude prices are a positive signal, but businesses should not scale back supply protections until fuel delivery reliability improves and the costs of refined fuels and other energy products stabilise.
Bottom line: the recovery of Gulf crude exports will not guarantee a recovery for Asia’s energy costs and operating conditions. The main commercial risk for Asia is the recovery of crude supply with elevated cost of delivering usable fuels. For business leaders, the priority is to monitor this gap, pinpoint the weakness of their financial buffers, determine whether these pressures are temporary or could have lasting consequences for profit, cashflow and investment returns.
Sources and methodology
[1] US Energy Information Administration, Short-Term Energy Outlook: Global Oil Markets, 6 October 2026. https://www.eia.gov/outlooks/steo/report/global_oil.php
[2] US Energy Information Administration, Global Energy Security Data, 12 August 2026. https://www.eia.gov/outlooks/steo/report/energysecurity/article.php
[3] International Energy Agency, Strait of Hormuz factsheet. https://www.iea.org/about/oil-security-and-emergency-response/strait-of-hormuz
[4] Reuters, Gulf Oil Flows Rise to Average 81% of Pre-War Rate in September, Data Shows, 6 October 2026. https://www.reuters.com/business/energy/gulf-oil-flows-rise-average-81-pre-war-rate-september-data-shows-2026-10-06/
[5] Reuters, Saudi Arabia Unexpectedly Cuts November Oil Prices to Asia to 6-Year Lows, 4–5 October 2026. https://www.reuters.com/business/energy/saudi-arabia-unexpectedly-cuts-oil-prices-asia-2026-10-04/
[6] International Monetary Fund, Asia’s Economic Resilience Is Being Tested by the Energy Shock, 16 April 2026. https://www.imf.org/en/blogs/articles/2026/04/16/asias-economic-resilience-is-being-tested-by-the-energy-shock
[7] Asian Development Bank, Asian Development Outlook September 2026. https://www.adb.org/outlook/editions/september-2026
[8] International Monetary Fund, The Energy Shock Is Testing Government Budgets, 18 June 2026. https://www.imf.org/en/blogs/articles/2026/06/18/the-energy-shock-is-testing-government-budgets
[9] World Bank, Fuel Imports (% of Merchandise Imports), indicator TM.VAL.FUEL.ZS.UN. https://data.worldbank.org/indicator/TM.VAL.FUEL.ZS.UN
[10] World Bank, Merchandise Imports (Current US$), indicator TM.VAL.MRCH.CD.WT. https://data.worldbank.org/indicator/TM.VAL.MRCH.CD.WT
[11] World Bank, GDP (Current US$), indicator NY.GDP.MKTP.CD. https://data.worldbank.org/indicator/NY.GDP.MKTP.CD
[12] Reuters, Indonesia Orders Cost-Cutting Measures to Keep Fiscal Deficit in Check, Sources Say, 8 October 2026. https://www.reuters.com/world/asia-pacific/indonesia-orders-cost-cutting-measures-keep-fiscal-deficit-check-sources-say-2026-10-08/
[13] Reuters, India may be best placed to fill a China-sized hole in fuel exports, 5 October 2026. https://www.reuters.com/commentary/reuters-open-interest/india-may-be-best-placed-fill-china-sized-hole-fuel-exports-2026-10-05/
[14] Reuters, India cuts windfall taxes on diesel, aviation fuel exports, 30 September 2026. https://www.reuters.com/world/india/india-cuts-windfall-taxes-diesel-aviation-fuel-exports-2026-09-30/
[15] ANTARA, Energy subsidies, compensation reach 84.3 pct of 2026 target, 9 October 2026. https://en.antaranews.com/amp/news/434854/energy-subsidies-compensation-reach-843-pct-of-2026-target-minister
[16] Indonesian Cabinet Secretariat, Government to Establish New Fuel Storage Facilities, 4 March 2026. https://setkab.go.id/en/govt-to-establish-new-fuel-storage-facilities/
[17] Reuters, Japan plans no crude oil release from national reserve in September, October, 25 August 2026. https://www.reuters.com/business/energy/japan-plans-no-crude-oil-release-national-reserve-september-october-2026-08-25/
[18] Reuters, Oil price volatility tops list of earnings risks for Japan firms, 7–8 October 2026. https://www.reuters.com/business/energy/oil-price-volatility-tops-list-earnings-risks-japan-firms-reuters-survey-2026-10-07/
[19] Singapore Ministry of Energy, Trade and Industry, Parliamentary reply, 6 October 2026. https://www.meti.gov.sg/newsroom/oral-reply-to-pq-on-impact-of-saudi-arabia-s-east-west-pipeline-shutdown-on-singapore-s-energy-security/
[20] Singapore Ministry of Energy, Trade and Industry, Natural Gas, updated 22 September 2026. https://www.meti.gov.sg/energy-and-carbon/energy-supply/natural-gas/
Methodology: independent desk-based macroeconomic and commercial risk analysis based on publicly available information up to 11 October 2026. The World Bank calculation is a static, first-round sensitivity using 2025 trade and GDP data and an assumed 20% fuel price increase. Country adjustments and corporate scenarios are qualitative assessments. No probabilities or country GDP impacts are estimated.

